Project Dashboard
Review project progress, status, and data distribution in Project Performance Dashboards
Manage project timelines, improve resource allocation, and update training and instructions to increase the efficiency of your dataset development initiatives. Administrators, organization owners, and workspace managers can access project performance dashboards to gain a better understanding of the team’s activity and progress against tasks, annotations, reviews, and labels for each project.
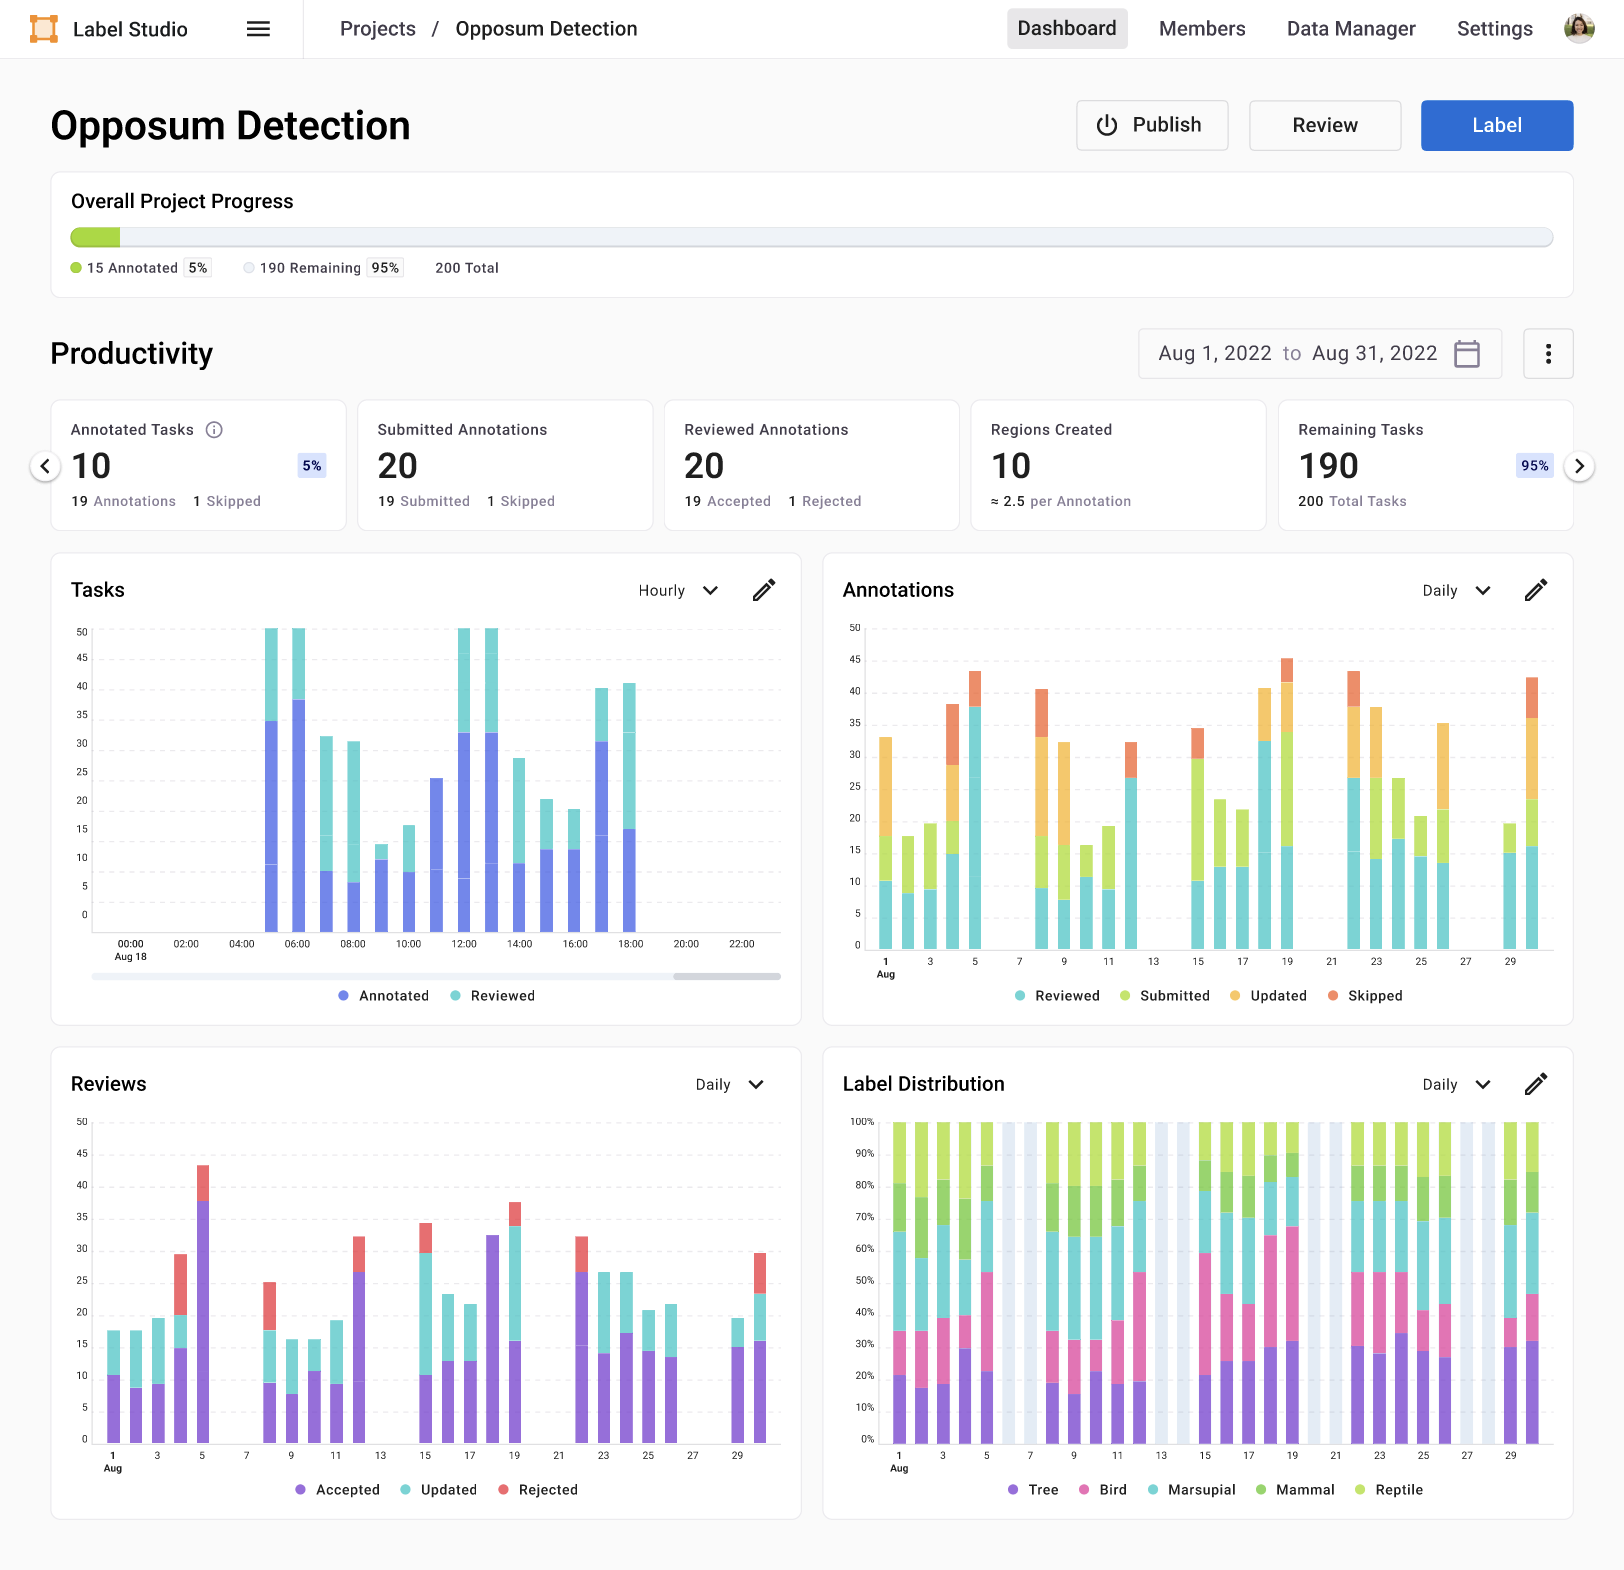
Navigate to your project’s Dashboard tab to discover the project’s progress at a holistic level and use the date time selector to discover trends for key performance indicators such as lead time or submitted annotations and to discover insights through time series charts for tasks, annotations, reviews, and label distributions.
Tip
You can reorder charts using drag and drop.
Review dataset progress
The dataset progress bar displays the number of tasks considered to be fully annotated for the project and the number of tasks remaining to be annotated. If the project requires a minimum annotation per task of more than one, some tasks might not appear as “annotated” because they are not yet fully annotated by the project standards. Learn more about minimum annotation and task overlap settings.
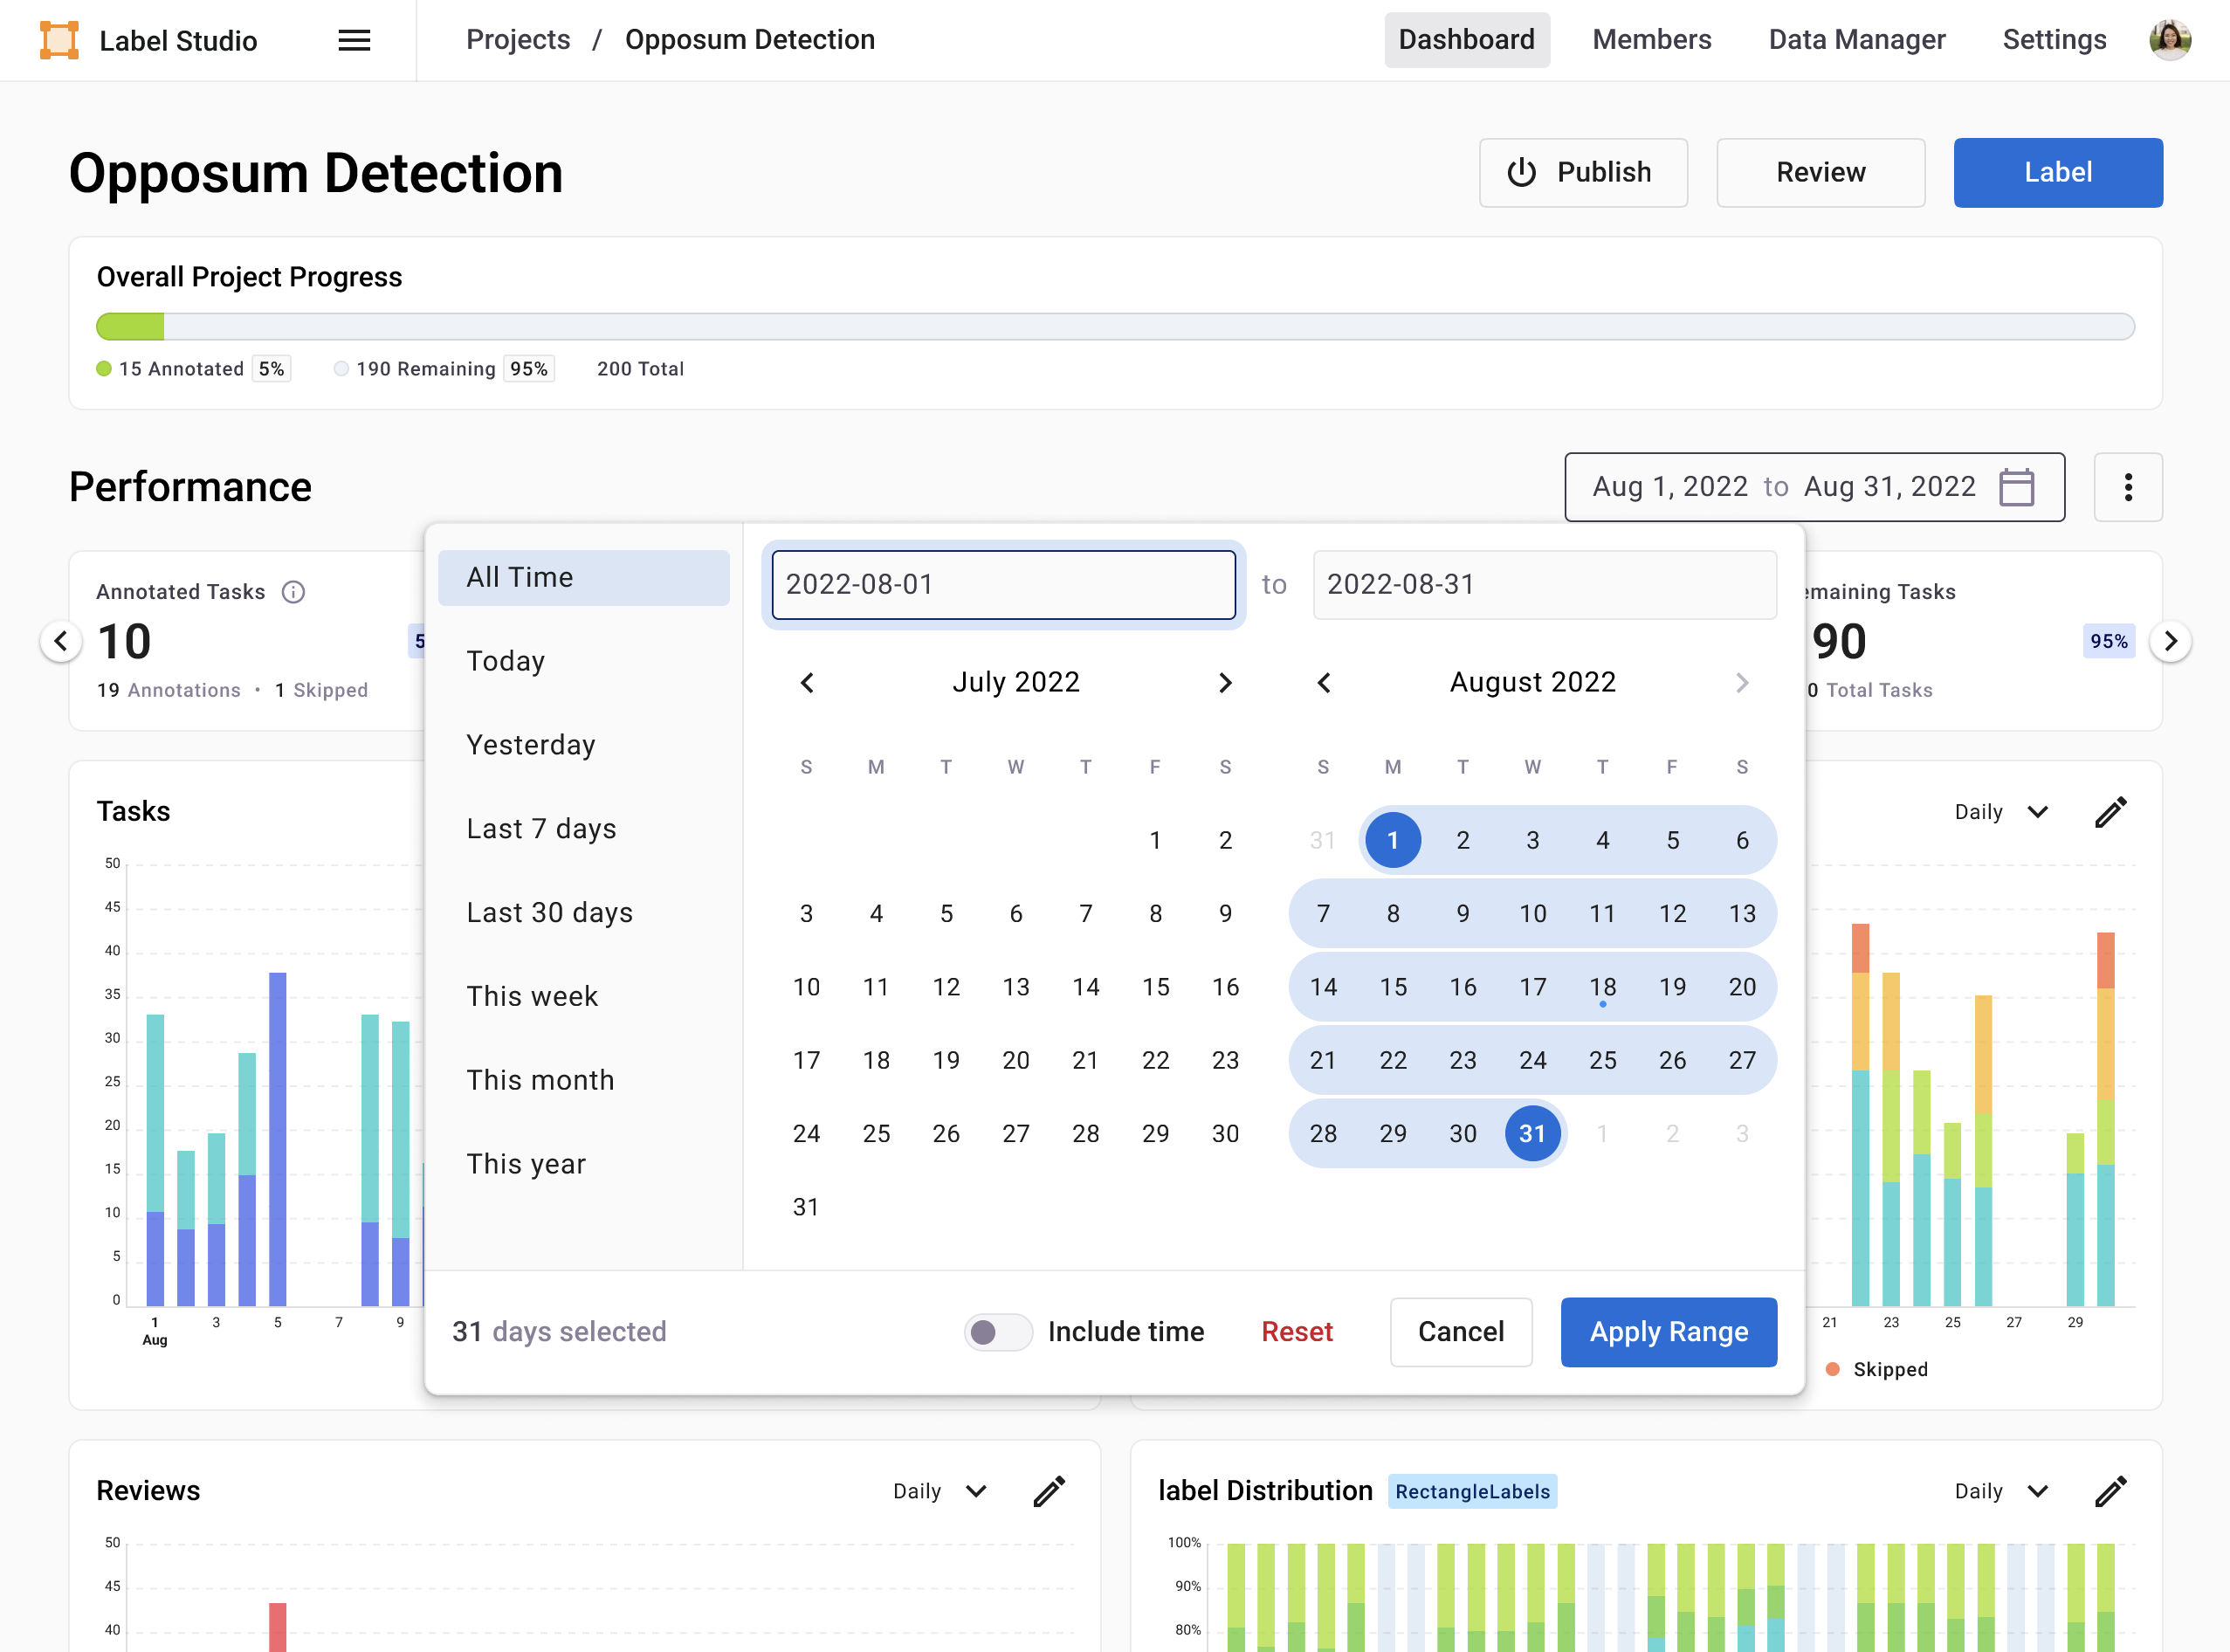
Date Time Selector
Choose from the list of preset time periods or define custom date ranges with or without a timestamp to update the KPI cards and time series charts and discover your project’s trends in performance and progress over time.
Understand progress and identify bottlenecks
Monitor your project’s key performance indicators to understand the progress and status of your dataset development initiatives. Make data-informed decisions for efficient resource allocation and update stakeholders on your project’s progress and milestones.
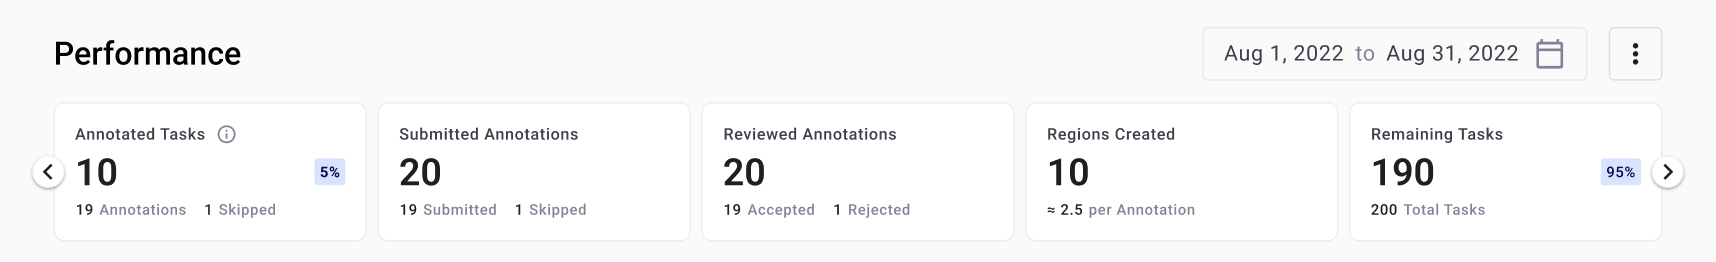
Use the carousel to click through the KPI cards which you can drag and drop to keep the highest impact metrics front and center.
Annotated Tasks: Sum of annotated tasks depends on the “annotation tasks per minimum” setting under the project’s “Quality” tab (also called consensus or overlap settings). This card also displays the percentage of annotated tasks (annotated tasks divided by total tasks available for annotation at query time) and in the small numbers at the bottom of the card, it shows the skipped annotations count (if enabled), and the remaining number of annotations for the time period selected that have not yet met the criteria defined in the project’s consensus settings.
Reviewed Annotations: Sum of annotations reviewed depends on the selection chosen for “mark task as reviewed” found under “Reviewing Options” in the “Review” tab. The card also displays the number of rejected and accepted annotations by all reviewers for the time period selected.
Submitted Annotations: Sum of annotations that have been submitted at any point in their lifecycle including skipped and empty annotations if applicable. Pre-annotations also count as submitted annotations. The smaller KPI’s include “Skipped” annotations which will only have a count if the skipped button is available to annotators and this count depends on what actions are available which are determined in “skip queue” settings under the “Annotation” tab found in project settings. The small number: “Submitted Annotations” does not include skipped annotations, but it does include empty annotations if that is enabled.
Regions Created: Sum of regions across all annotations for the time period selected. Most labeling configurations will have regions (even text spans count as a region) and a relation also counts as a region. The card also displays the average number of regions per annotation as a small number.
Remaining Tasks: Sum of tasks left to be completed (for the time period selected) which is dependent on several project settings: quality overlap (consensus) settings, review options for tasks marked as reviewed, and skipped queue settings for annotators. This card also displays the total tasks available in the project (at that point in time) and the percentage of tasks completed for the project for the time period selected.
Tasks Pending Review: Remaining tasks that have not been reviewed for annotations submitted during the time period specified. This card also displays the annotation count for annotations submitted but not yet reviewed.
Lead Time: The average time in hours it has taken to complete all annotations for the time period selected.
Average Time Per Task: The average time in minutes it has taken to complete all annotations required for a task (dependent on project settings) for the time period selected.
Average Time Per Label: The average time (sum of all annotations’ lead time divided by all annotations ) in seconds that it has taken to annotate a label for the time period selected.
Charts
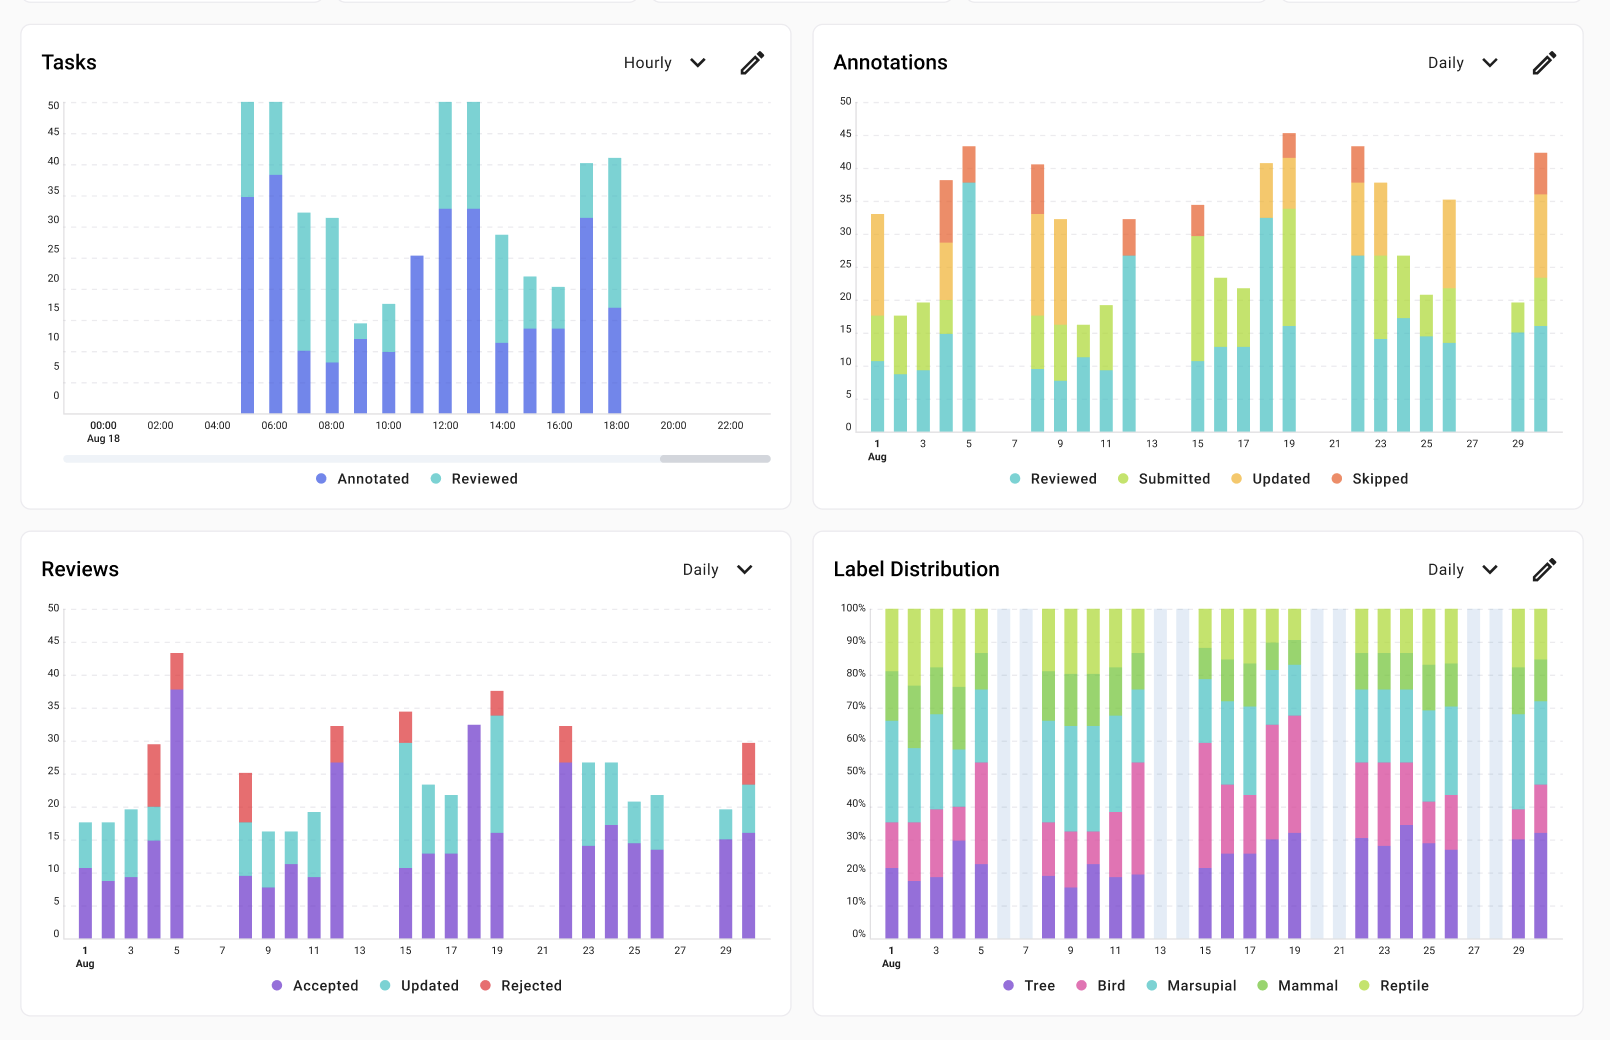
Each time series chart can be viewed as is or can be customized by clicking on the colored circle next to each metric’s name in the chart legend. For instance, click on “Annotated” in Task Chart to view only the reviewed tasks over time. You can also change the chart granularity for each chart using the dropdown menu which provides time range presets that are most appropriate for the time period selected in the date time selector. To reset the charts back to the default view, use the flyout menu next to the date time selector.
Annotations distribution
View annotations that have been reviewed, updated, submitted, and skipped during a specific time range to optimize resource allocation and training for increased throughput.
For example, if you notice there is a high number of skipped annotations you can update the annotation instructions or perform retraining as necessary for your labeling team. If you see a gap between the number of submitted annotations and reviewed annotations you can either assign more reviewers to increase throughput or meet with reviewers to understand why they haven’t kept up with annotation cadence.
Reviews distribution
Understand details of reviews performed by analyzing the accepted, rejected, and updated states for annotations reviewed and compare with the annotations chart to identify gaps or spikes in activity.
For example, if you have a high number of annotations that were submitted weeks ago and reviews that only started days ago there is an opportunity to identify why the review process was not started immediately upon submission of annotations.
Task distribution
View the status and progress of reviewed and annotated tasks during a specific time range in order to understand if more annotators or reviewers should be assigned to the project.
For example, if you notice a high discrepancy between tasks that have been reviewed versus tasks that have been annotated, you might want to assign more reviewers to the project to complete it by your deadline.
Label distribution
View up to 30 labels that were used during annotation for the time period selected in a stacked bar chart to identify the distribution of labels at various levels of granularity over time. Use this chart to identify possible problems with your dataset distribution, such as an unbalanced dataset where some labels are overrepresented in an annotated dataset compared with others.
For example, if you’re developing a dataset of OCR images, and 90% of your tasks have Text labels and 10% have Handwriting labels, you might want to increase the number of images of handwriting in your dataset, to improve the eventual accuracy of a machine learning model trained on this dataset.
If you have a labeling configuration that contains multiple label groups, you will see a separate chart for each group showing the label counts within that group.
Tip
From the menu in the upper right of each chart, select Summary to view a donut chart showing label distribution.